
California’s official unemployment rate — the percentage of jobless workers among the state’s labor force — remained unchanged in September at 5.3%.
That doesn’t sound alarming, unless one dives more deeply into the data.
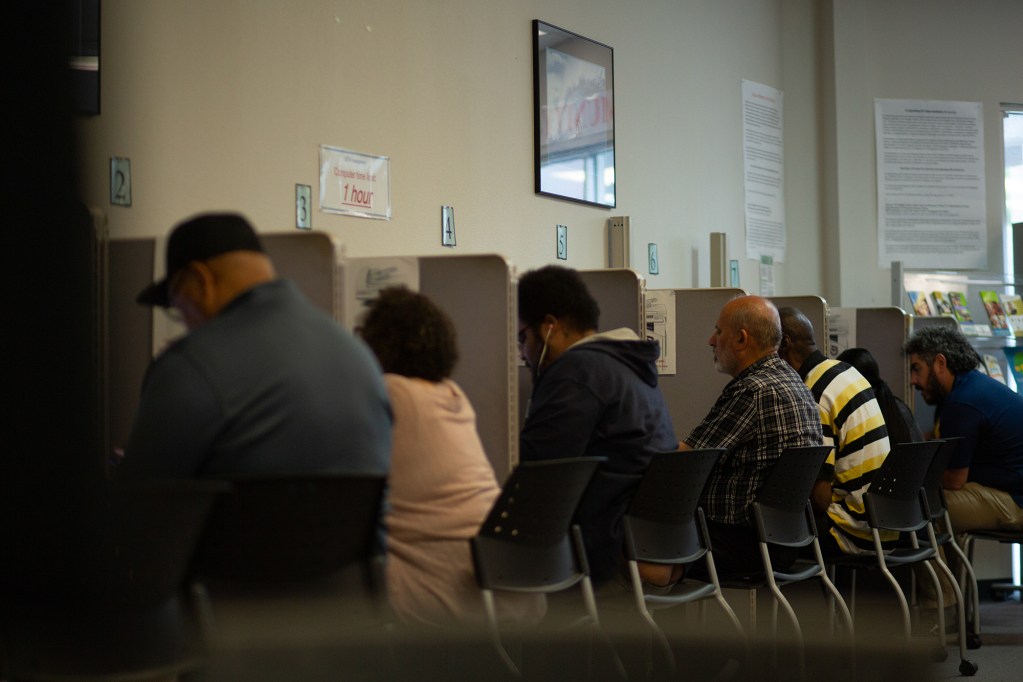
For one thing, it means that slightly more than a million California adults who say they want to work can’t find jobs, 64,100 more than a year prior, according to California’s Employment Development Department. California’s jobless rate is consistently among the highest in the nation.
The rate is obviously affected not only by the number of those seeking work and not finding it, but by the size of the labor force, which the federal government defines as those 16 years and older who are either working or looking for work.
The state’s labor force participation rate hit a high of 68% of its adults in 1990, has dropped steadily since, and is now below 63%, according to the Public Policy Institute of California. Currently, the state pegs the labor force at 19.4 million, of which 18.4 million are working.
But working at what and how much?
Officially, a person is counted as employed if they are working for wages as little as one hour per week. That minimalist definition makes employment statistics appear more positive than reality warrants.
Although the federal Bureau of Labor Statistics releases the widely cited official unemployment rates each month, the agency also recognizes their limitations and issues other indices that paint a more accurate picture.
The most detailed, dubbed U-6, is defined as “total unemployed, plus all persons marginally attached to the labor force, plus total employed part time for economic reasons, as a percent of the civilian labor force plus all persons marginally attached to the labor force.”
Typically, U-6 rates are nearly twice as large as the official unemployment rates. Currently, the traditional unemployment rate for the nation is 4.1% but its U-6 rate is 7.7%. Through the first half of 2024, California’s U-6 rate was 9.6%, the highest of any state.
California’s high measurement implies that it has disproportionate levels of part-time workers or people who may be counted as potential workers but are not particularly interested in getting jobs.
Combined with the state’s declining labor force participation, its high U-6 measure reveals a less-than-healthy employment situation and explains, at least partially, why employers find it difficult to find qualified workers even though there are more than a million people who are theoretically seeking jobs.
But the picture is even cloudier when one overlays an even more nuanced measure advanced by the Washington-based Ludwig Institute for Shared Economic Prosperity, what it calls the “True Rate of Unemployment,” or TRU.
TRU calculates the proportion of “functionally unemployed” members of the labor force, defined as “the jobless plus those seeking, but unable to find, full-time employment paying above poverty wages (pegged at $25,000 a year in 2024 dollars).”
While the nation’s traditionally calculated unemployment rate was 4.1% in September, Ludwig pegged its “true rate” at 23.9%, nearly six times as high — and California was very close to the national rate at 23.5%. Numerous other states were worse.
Ludwig also calculates TRU for the entire adult population, not just the labor force, and in California it’s 52.5%, meaning fewer than half are working jobs that pay a living wage.
That is — or should be — a disturbing number, and contributes to California having such a large number of workers earning incomes that cannot cope with the state’s incredibly high costs of housing, utilities are other necessities of life.